
By the Visualization Core Lab team and Caitlin Clark
In the University’s Visualization Core Lab (KVL), scientists specialize in visualization and data analytics and the use of computational resources to explore and present research data.
“The KVL team augments the efforts and domain expertise of KAUST researchers by providing complementary technical expertise with a variety of exploratory visualization and analytic tools in our state-of-the-art facilities,” explained Thomas Theussl, visualization scientist, KVL.
KVL’s facilities for visual data exploration include large-scale and ultra-high-resolution 3D virtual reality (VR) and 2D tiled display environments. These allow for advanced exploratory analysis of large datasets produced by supercomputers, scientific imaging instruments and genome sequencers, for example. Uniquely, by utilizing VR, researchers experience a fully immersive view of the data.
“Visualization in VR enables scientists to explore complex datasets in 3D space and interact with them, leading to better insights and understanding,” noted Theussl.
Through the use of the facilities and expertise in KVL, KAUST statisticians like Distinguished Professor Marc Genton and Associate Professor Ying Sun have found new opportunities to visualize, explore and better understand their data. Their collaborative work with KVL also allows them to improve existing statistical models.
In a long-term collaboration, KVL team members and Genton and Sun examined several different solutions to visualize data in 3D using VR. The work resulted in a paper published in the Journal of the Royal Statistical Society: Series A.

KAUST Distinguished Professor Marc Genton (left) and Associate Professor Ying Sun (right) work with the University’s Visualization Core Lab to visualize and explore data from their statistics research. File photos.
Displaying complex data sets
Using a data set that came from global temperature data from 2006 to 2100, Genton, Sun and the KVL team displayed the original data set and a simulation from the statistical model—or emulator—within KVL’s CORNEA VR environment.
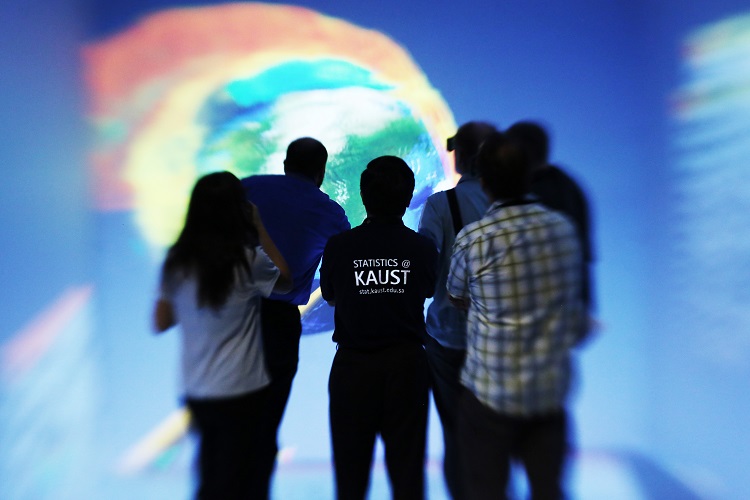
“CORNEA, a high-resolution, fully immersive VR 3D environment, consists of six walls and a 200-million pixel stereoscopic display, allowing for a unique way to visualize statistical output,” said Dina Garatly, visualization scientist, KVL. “In CORNEA, users wear a tracking VR headset that has wireless motion capture technology, enabling them to interactively explore the environment and data displayed there at an unmatched level.”
By employing the tracking VR headset, users explored and interacted with the temperature data set by moving around CORNEA’s physical space. They “examined multiple features of the data and how visually similar the climate model was compared to the statistical simulation,” the researchers stated in their paper.
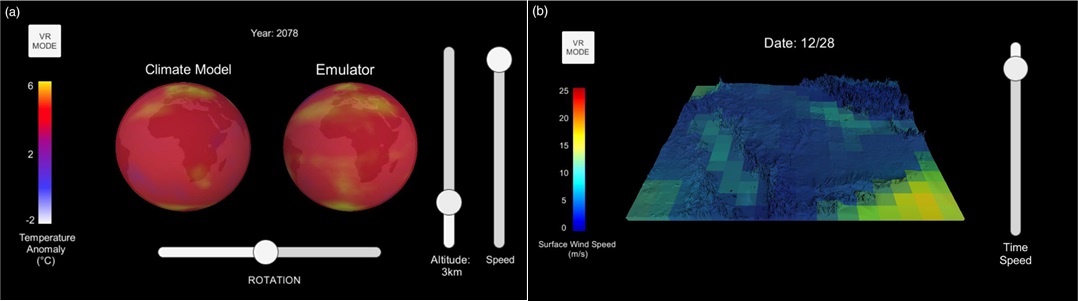
The use of virtual reality for comparing a climate model to an emulator is pictured in (a). A visualization for surface winds on the Arabian Peninsula is pictured in (b). Images courtesy of the KAUST Visualization Core Lab, Marc Genton and Ying Sun.
“Visualizing the data using a VR headset in CORNEA enabled the scientists to explore and compare the climate model and the statistical simulation in a sophisticated, more efficient manner, in which they had full control of the parameters in real time in an immersive environment,” noted Garatly.
To take their work further, Genton and Sun used the CORNEA VR environment to visualize Mount Pinatubo’s 1991 eruption in the Philippines; this was the second-largest volcanic eruption of the 20th century. The visualization allowed them to see “the extent of the eruption and its diffusion in the [Earth’s] equatorial belt,” they wrote.
“CORNEA’s VR environment additionally allows the observer to explore surfaces with geometry considerably more sophisticated than the spherical shell of the planet,” Sun said.
Beyond CORNEA
Although CORNEA provides a unique environment in which to visualize statistical output, its use is “limited to the physical space where it is installed,” stated Genton. “It is also difficult to take the CORNEA experience to a greater audience because it is located in a specific location.”
To deal with this challenge, Genton, Sun and the KVL team developed two different smartphone apps for wider and more accessible interactive VR visualization of data. The apps—called “global surface wind” and “Saudi surface wind”—may be freely acquired for both Android and iPhone. The global surface wind app displays annual winds across the Earth from between 1920 to 2100, according to a climate model and a statistical model. In the Saudi surface wind app, daily wind in the Arabian Peninsula is visualized from 1920 to 2100.
Both apps allow interactive exploration of the data with or without VR hardware. In VR mode, a simple device like Google Cardboard, a foldable, inexpensive VR viewer made of cardboard, can be used to transform the phone into a VR headset. Users may experience the apps’ data in 3D stereoscopic view, allowing for a more immediate and intuitive perception of 3D data aspects, such as altitude and topological features.
“For example, visualizing the Arabian Peninsula in 3D makes it more intuitive for users of the app to understand the speed of wind there and how it’s related to the terrain,” noted Garatly.

The KAUST Visualization Core Lab team (from left to right: Thomas Theussl, Glendon Holst, Dina Garatly and Sohaib Ghani) showcases the use of the University’s 3D virtual reality CORNEA environment. Photo by Andrea Bachofen-Echt.
“The main challenge for the KVL team was to develop new tools and workflows for the transformation of large-scale data into an efficient yet robust visualization tool for small-scale mobile platforms using VR,” she explained. “The team first worked to mathematically translate the multidimensional data into mappable textures compatible with the target system architectures of iOS and Android. Next, the KVL team then created intuitive user interfaces for both VR and traditional experiences—all within each of the two apps. This is something that hasn’t really been done before.”
“The existing development tools for mobile apps are not equipped to address big data visualization,” Garatly said. “Our team made that possible by bringing a CORNEA-like VR experience to anyone with a mobile phone and a $10 Google Cardboard VR viewer.”
The future for data interaction
“Although the VR apps we created are a way forward for accessible visualization of data, the lack of a motion-tracking device in a smartphone and lower image quality and refreshing frequency present some challenges,” noted Genton. “With the KVL team, we are now exploring a compromise between CORNEA and VR apps for the VR visualization of data—a head-mounted device (HMD) with motion-tracking sensors.”
“The HMD with motion-tracking sensors enables VR spatial interaction with the data without the use of the CORNEA environment,” said Garatly. “We are examining the benefits of the HMD in our current collaboration with Profs. Genton and Sun to learn more about tropical cyclone occurrence over the Arabian Sea, the northwestern portion of the Indian Ocean.”
“The next step would be merging the VR environment with the real world to create an augmented reality experience—this would produce a better interaction and experience in the visualization,” she continued. “However, we cannot proceed much further with this until the technology is available for the general public and statisticians to use.”
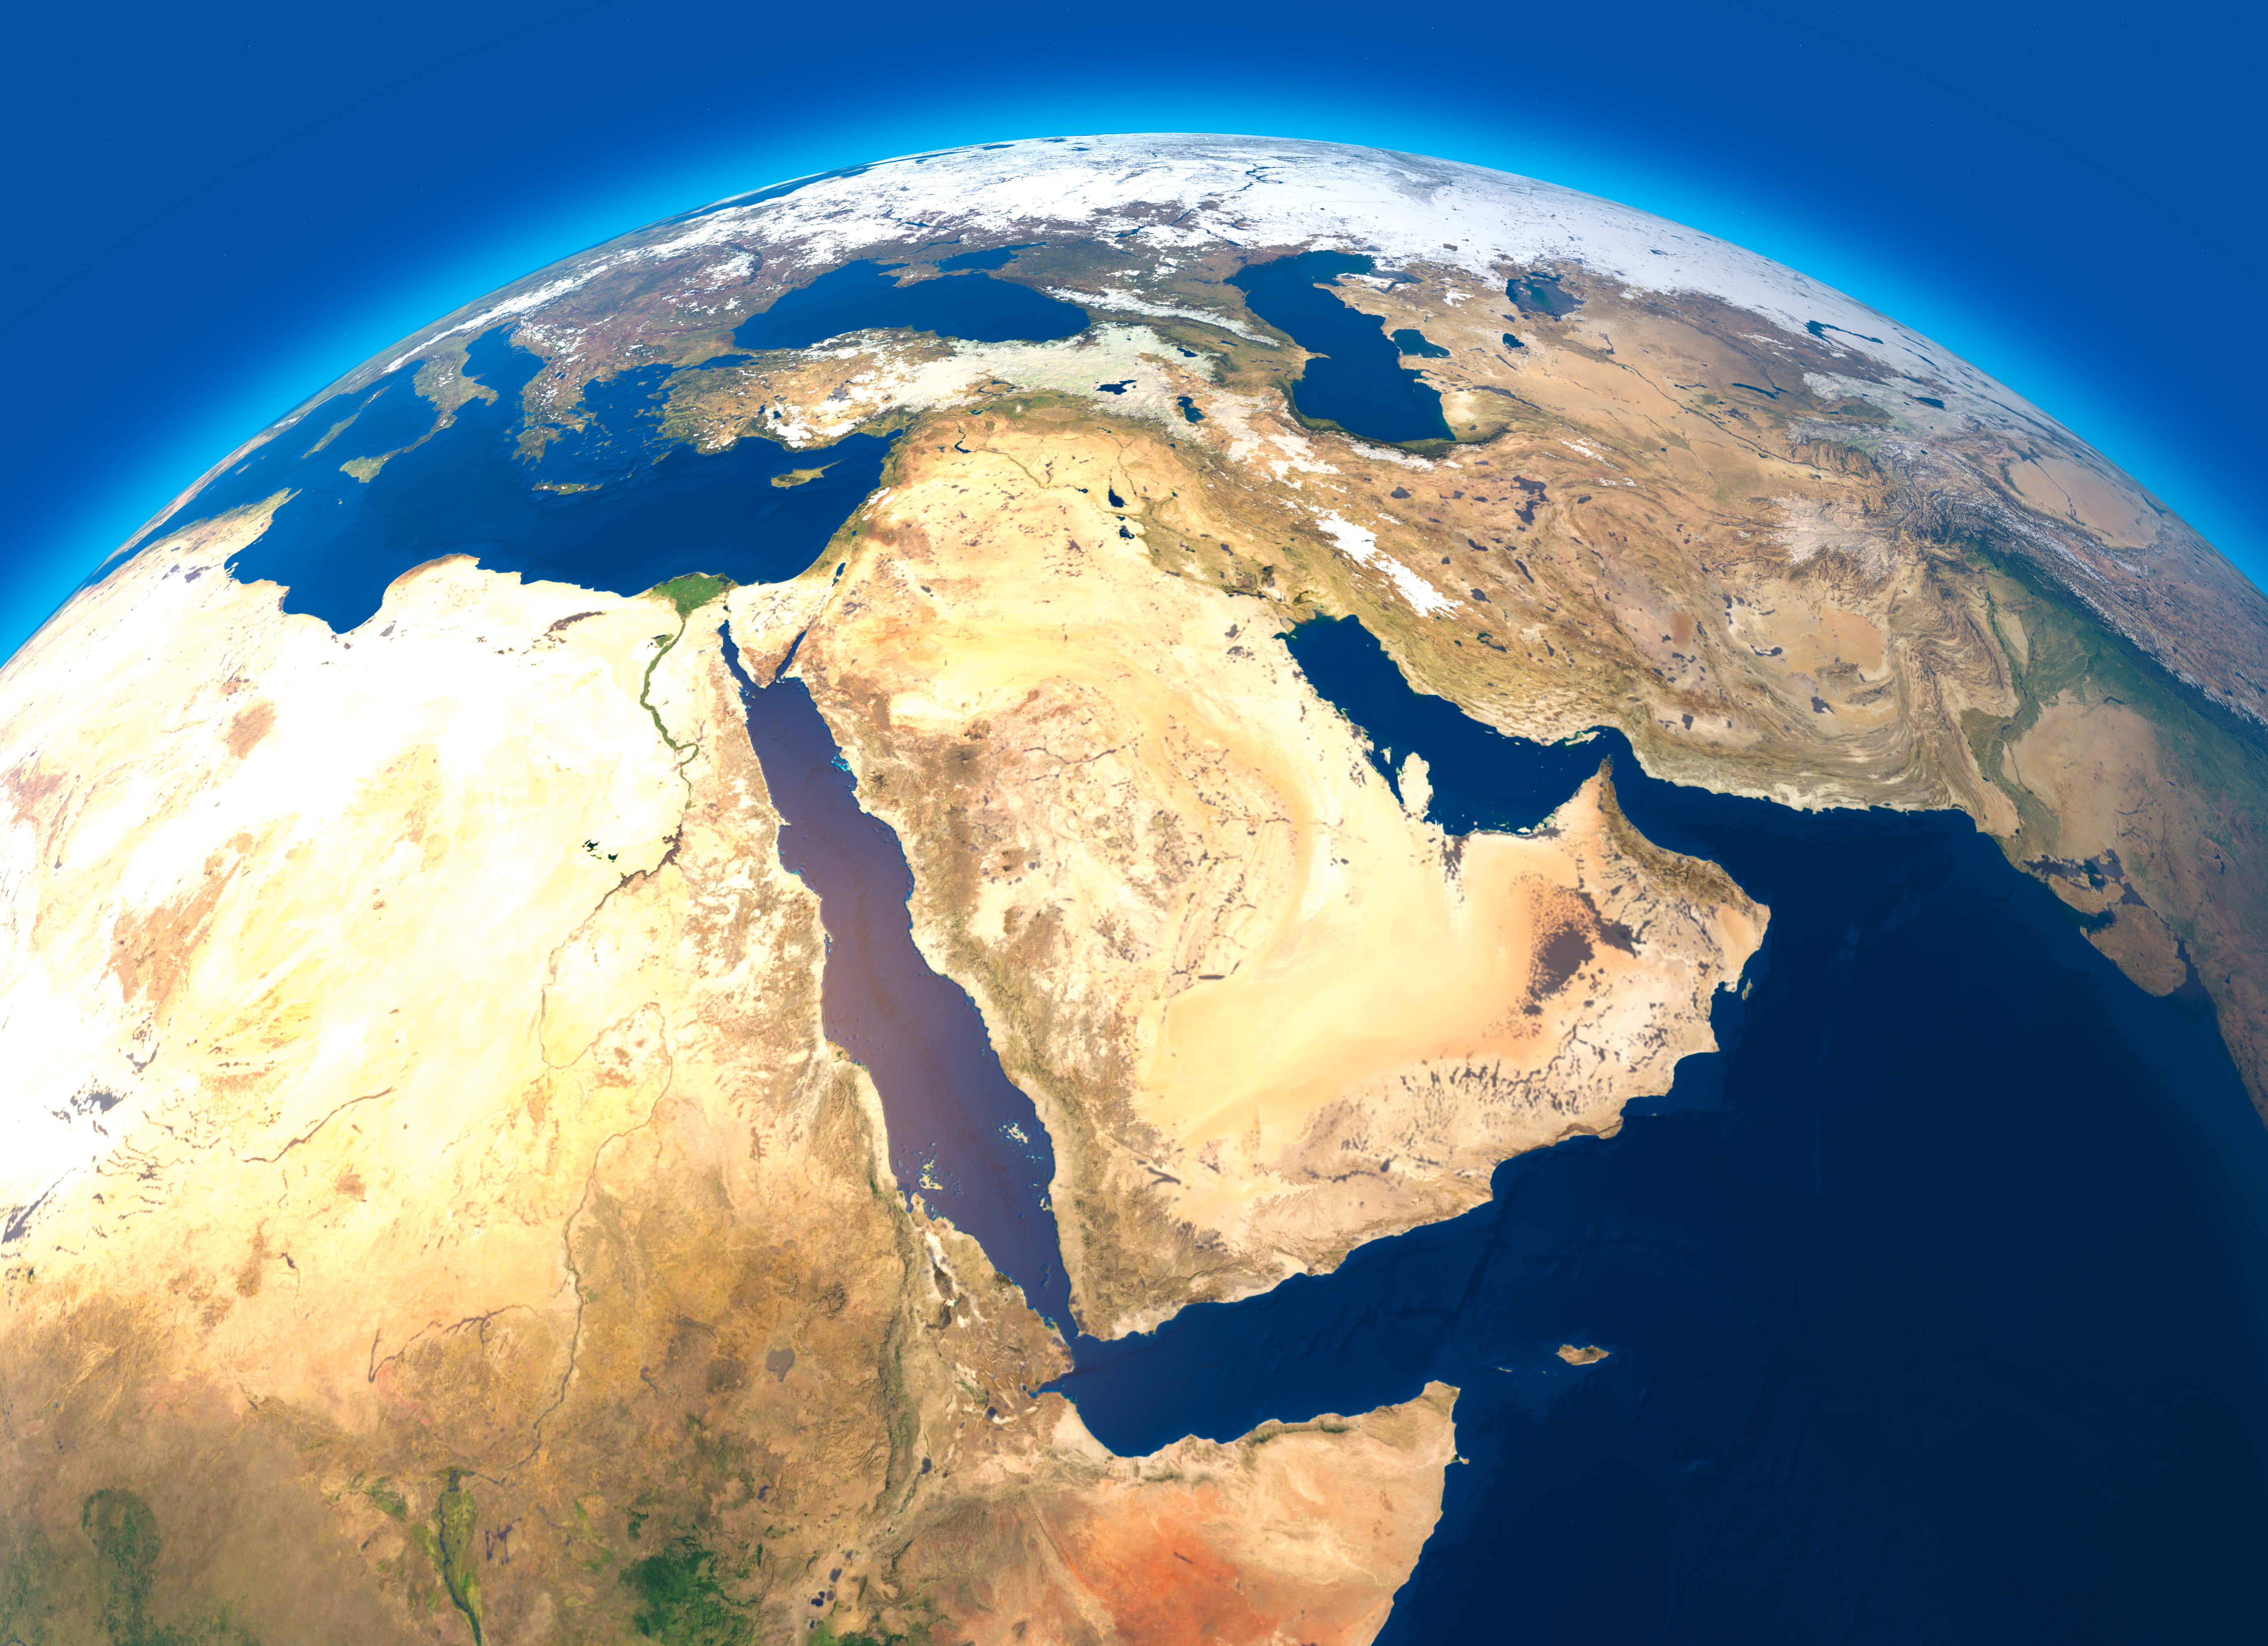
Scientists from the KAUST Visualization Core Lab work with statistics colleagues to examine the use of virtual reality headsets in exploring tropical cyclones over the Arabian Sea. Image courtesy of Shutterstock.
“KVL provides researchers with access to HMDs, including several HTC Vives and an Oculus Rift,” said Sohaib Ghani, lead visualization scientist, KVL. “The VR systems consist of a HMD, two handheld controllers and a tracking system. HMDs can track the scientist’s head and handheld controller movements in 3D space, making an immersive environment more accessible than large installations, such as CORNEA. HMDs are powerful and easy-to-use technologies that enable scientists to explore complex structures with minimal training and stunning results.”
“KVL’s staff members have the expertise to transform standard large-scale scientific datasets to VR/augmented reality visualizations on multiple platforms, such as CORNEA, HTC Vive, Oculus Rift and others,” Ghani said.
“The ability to explore data in a 3D, immersive environment offers a more powerful tool for interpreting data than 2D planar mapping,” added Sun.