The Visualization Core Lab provides visualization support and advanced analytics capabilities to a range of stakeholders including KAUST’s Professor Ibrahim Hoteit and his team. They are focused on developing and continuously refining new mathematical models that can be used to predict water circulation patterns and weather phenomena in the Red Sea. By using our analytical and virtual reality environments, they can see their complex data in a number of useful ways.
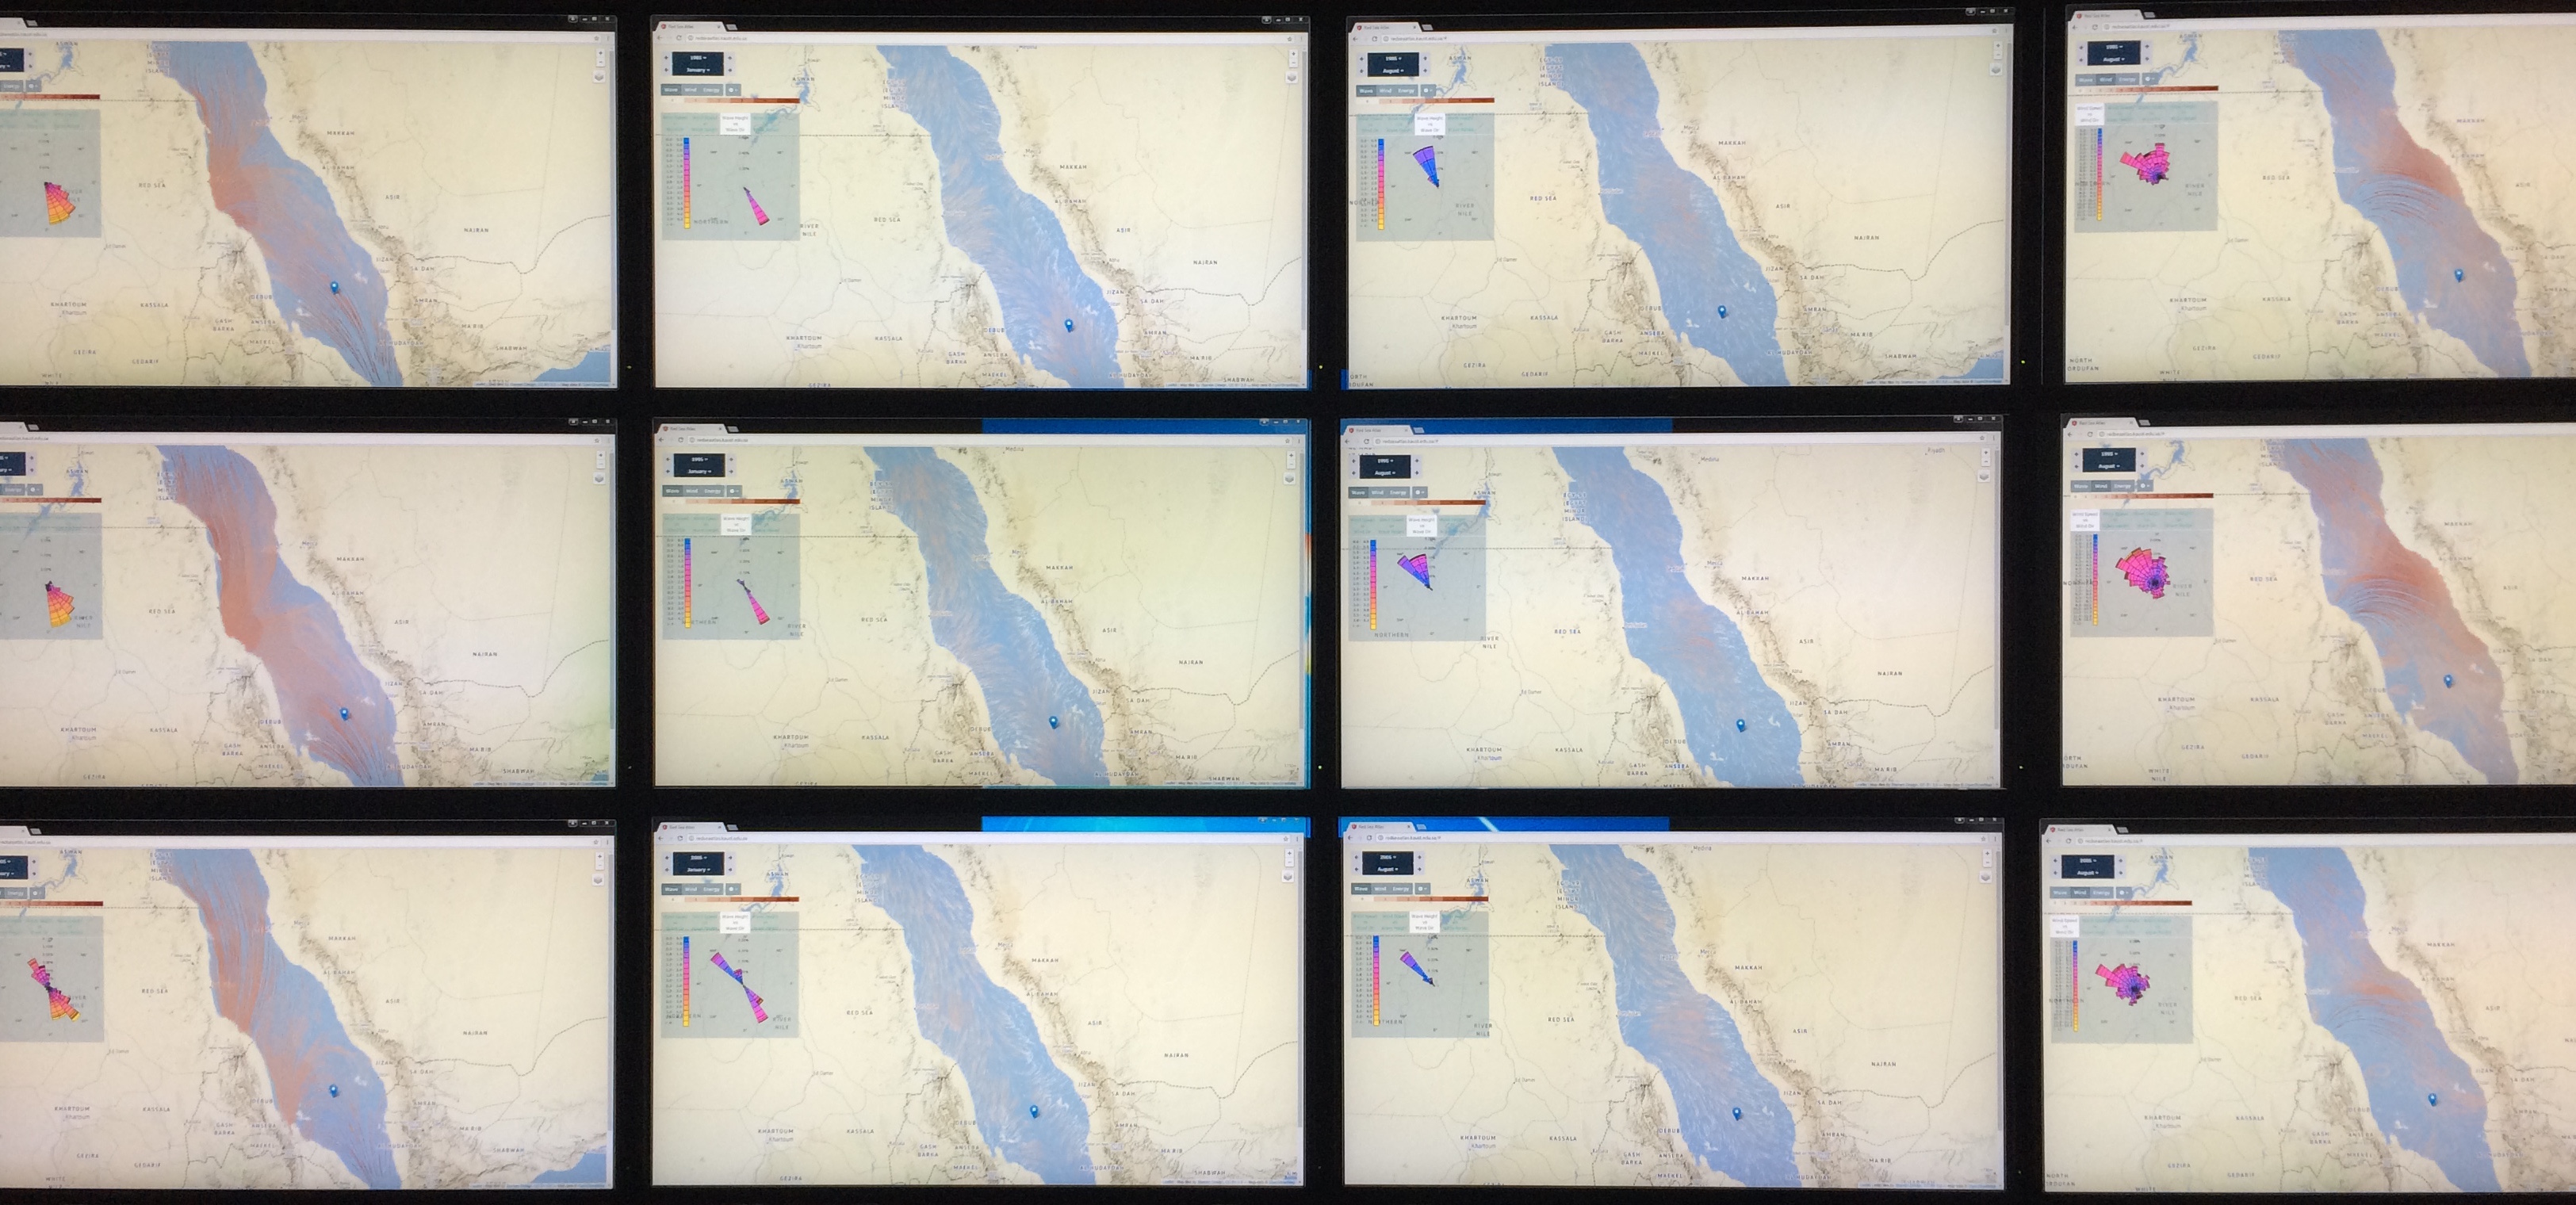
The analytical interfaces we’ve created allow them to explore, for example, datasets that combine wave, wind and energy data in the Red Sea spanning multiple decades, researchers can explore new hypotheses that link those events to other global seasonal climate phenomena, such as “El Niño.” You can explore this interface yourself at http://redseaatlas.kaust.edu.sa.
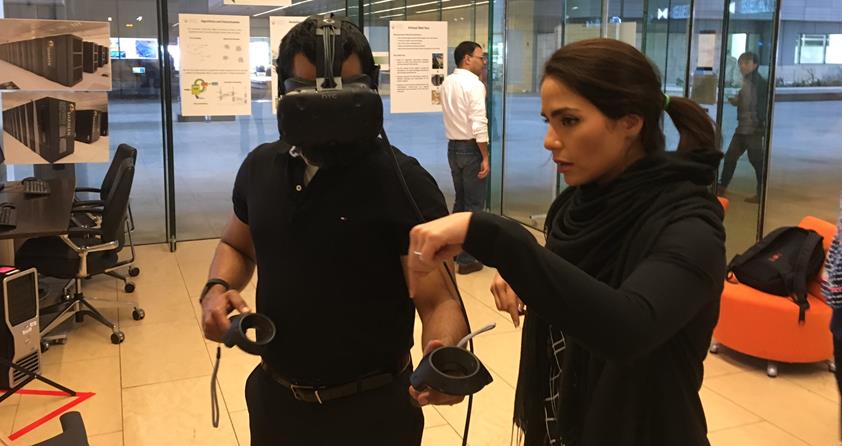
We’ve also developed virtual reality interfaces to enable the researchers to explore the data in 3D. These VR environments are enabling a closer look at particularly interesting weather simulations such as one that recreates the conditions for cyclone Chapala, which occurred in the Indian Ocean and affected Yemen and Saudi Arabia in 2015. These applications are also used to interactively plan scenarios for water circulation in the Red Sea. By using these, scientists can study how nutrients (or contaminants) would propagate through the Red Sea in different conditions and times of the year.

Multi-view dashboard looking at patterns of wave/wind interaction in the Red Sea, exploring summer/winter differences over three decades.

Multi-view dashboard looking at patterns of wave/wind interaction in the Red Sea, exploring summer/winter differences over three decades.
Showcasing at CEMSE Open Day
We recently showcased our collaboration with Dr. Hoteit’s team at the CEMSE Open Day at KAUST on December 4. We featured all of the above applications and encouraged visitors to explore the data themselves.
About the Visualization Core Lab
The Visualization Core Lab provides researchers with visualization, sonification, and computational resources for exploration and presentation of scientific data. Services of the laboratory include 2D and 3D display environments, highly specialized and immersive audio, monoscopic and stereoscopic displays, and fully integrated portable desktop applications. Our staff engages with KAUST researchers to understand their data exploration requirements and provides solutions to enhance their data workflows.

