Creating a meaningful visualization workflow that scales with big data
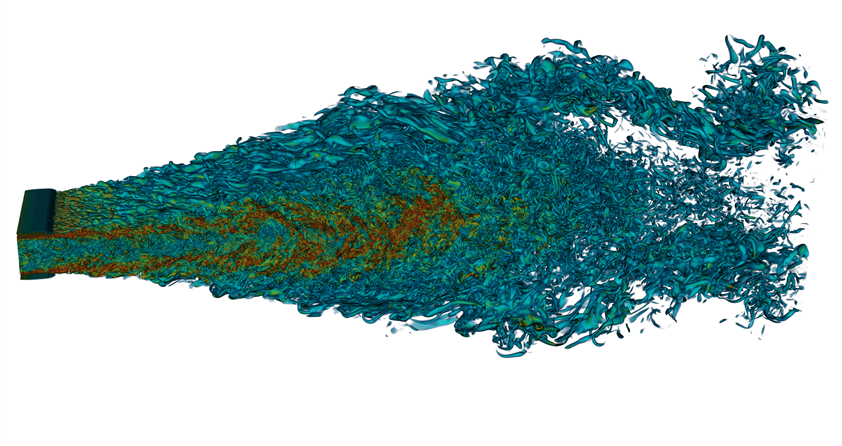
Dr. Antonio Attili and Prof. Fabrizio Bisetti, while part of the Clean Combustion Research Center at KAUST, ran a 22 billion-point methane-air premixed turbulent flame direct numerical simulation (DNS) using our Shaheen II supercomputer. The Visualization Core Lab was then tasked with the challenge of visualizing this largest ever simulation, to assist researchers in understanding how turbulence in the gasses and flame affect its efficiency. The numerical simulation closely mimics the conditions of gas turbines for energy production.
With over 4TB of data per timestep, and hundreds of timesteps computed, we worked with the domain scientists to create a meaningful visualization workflow that scales with such large dataset sizes. Our scientists used several hundred cores of the Shaheen II supercomputer, a high-throughput 10G network link between the Visualization and Supercomputing Core Labs, and a high-performance 16-node GPGPU cluster to produce a parallel visualization technique that can also be interactive, for large datasets.
The accuracy and fidelity of these simulations are comparable to very well-characterized experiments. With the growth of computer power and the unique facilities in KAUST, researchers have been able to perform simulations with comparable (if not larger) Reynolds number than that in the most advanced experiments available in the combustion community.
Looking to the future
While the visualization techniques utilized here focused on post-simulation methods, the Visualization Core Lab is working on developing workflows that can perform visualization and analysis while the simulations are running in Shaheen II, saving precious input/output time that can be used to advance the simulation or to perform in-situ analyses.

